Forms Overview Page
In this guide, we'll go over the forms overview page.
Go to app.tyfoom.com
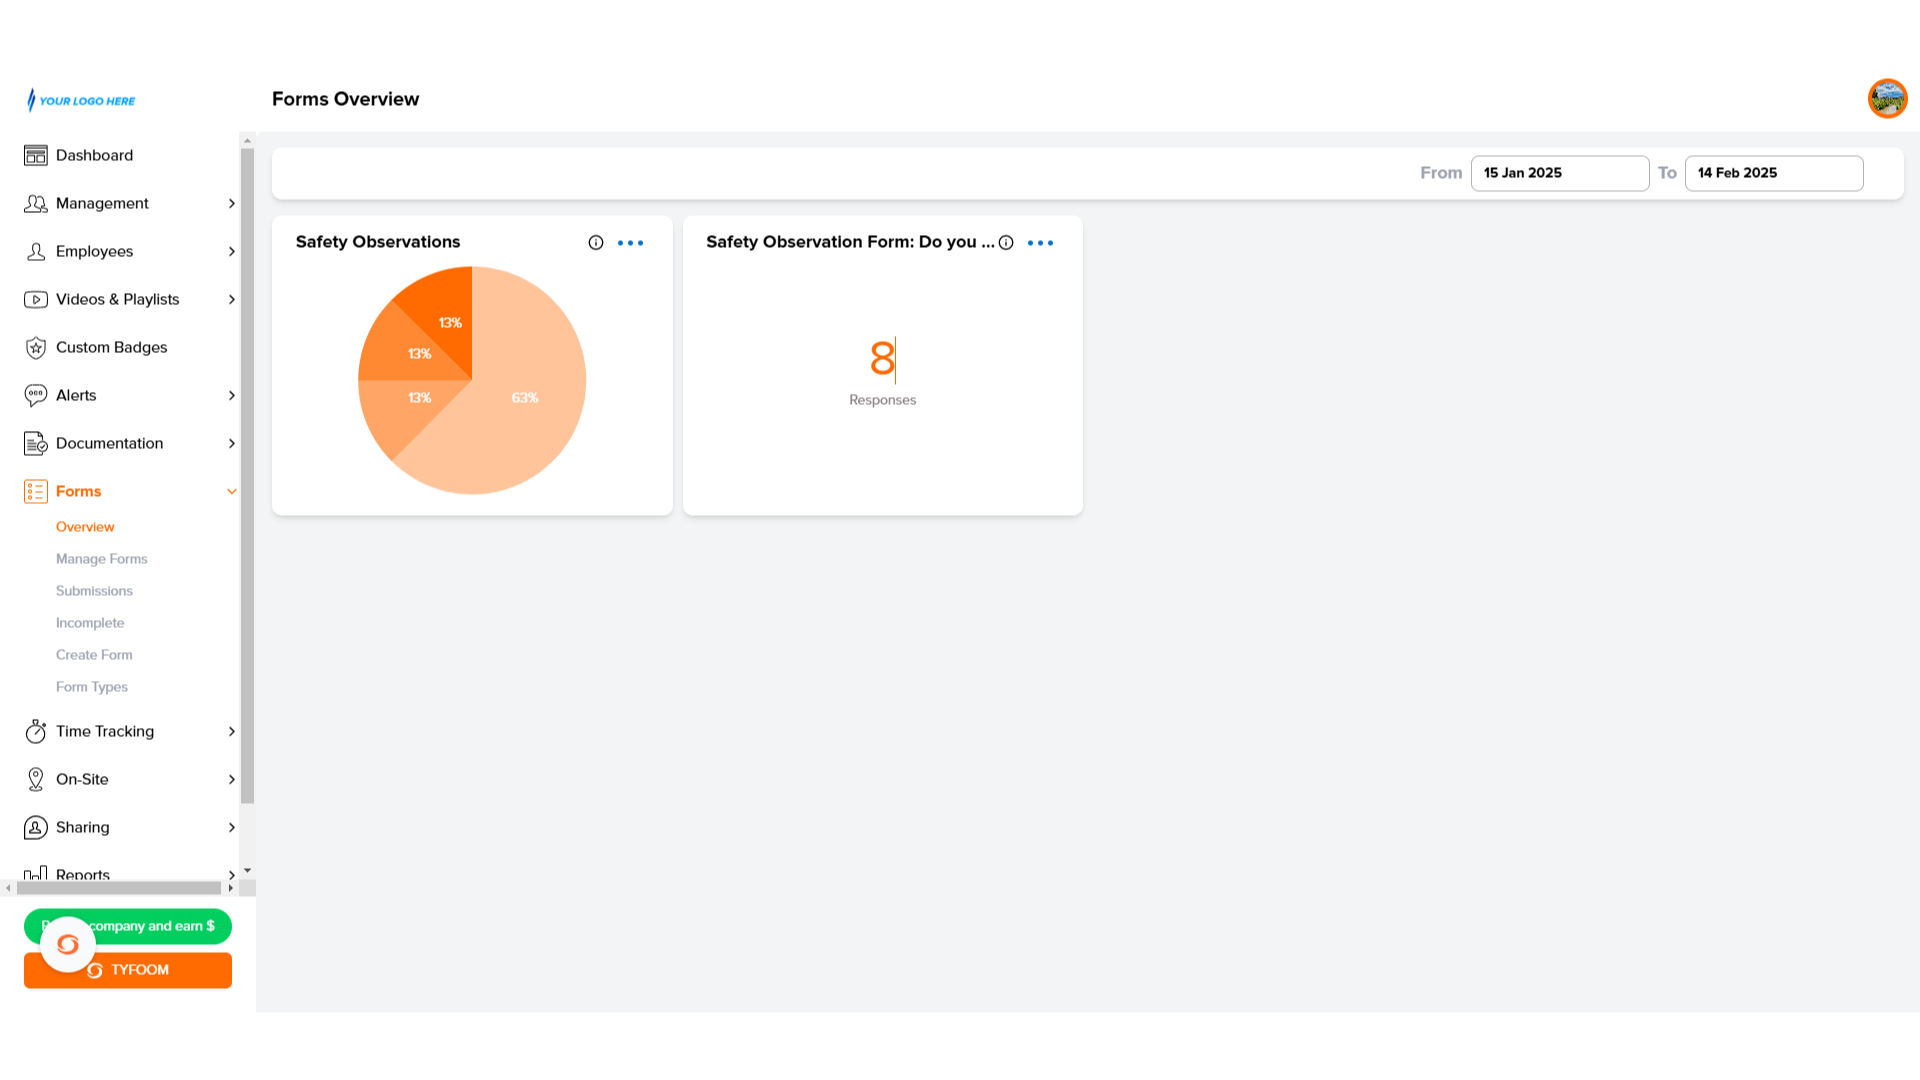
1. Overview
The forms overview page, allows you to track key data shown, as graphs from various form questions. For example, it could be used to display the number of windshields that have recorded as having Rock chips during a vehicle inspection.
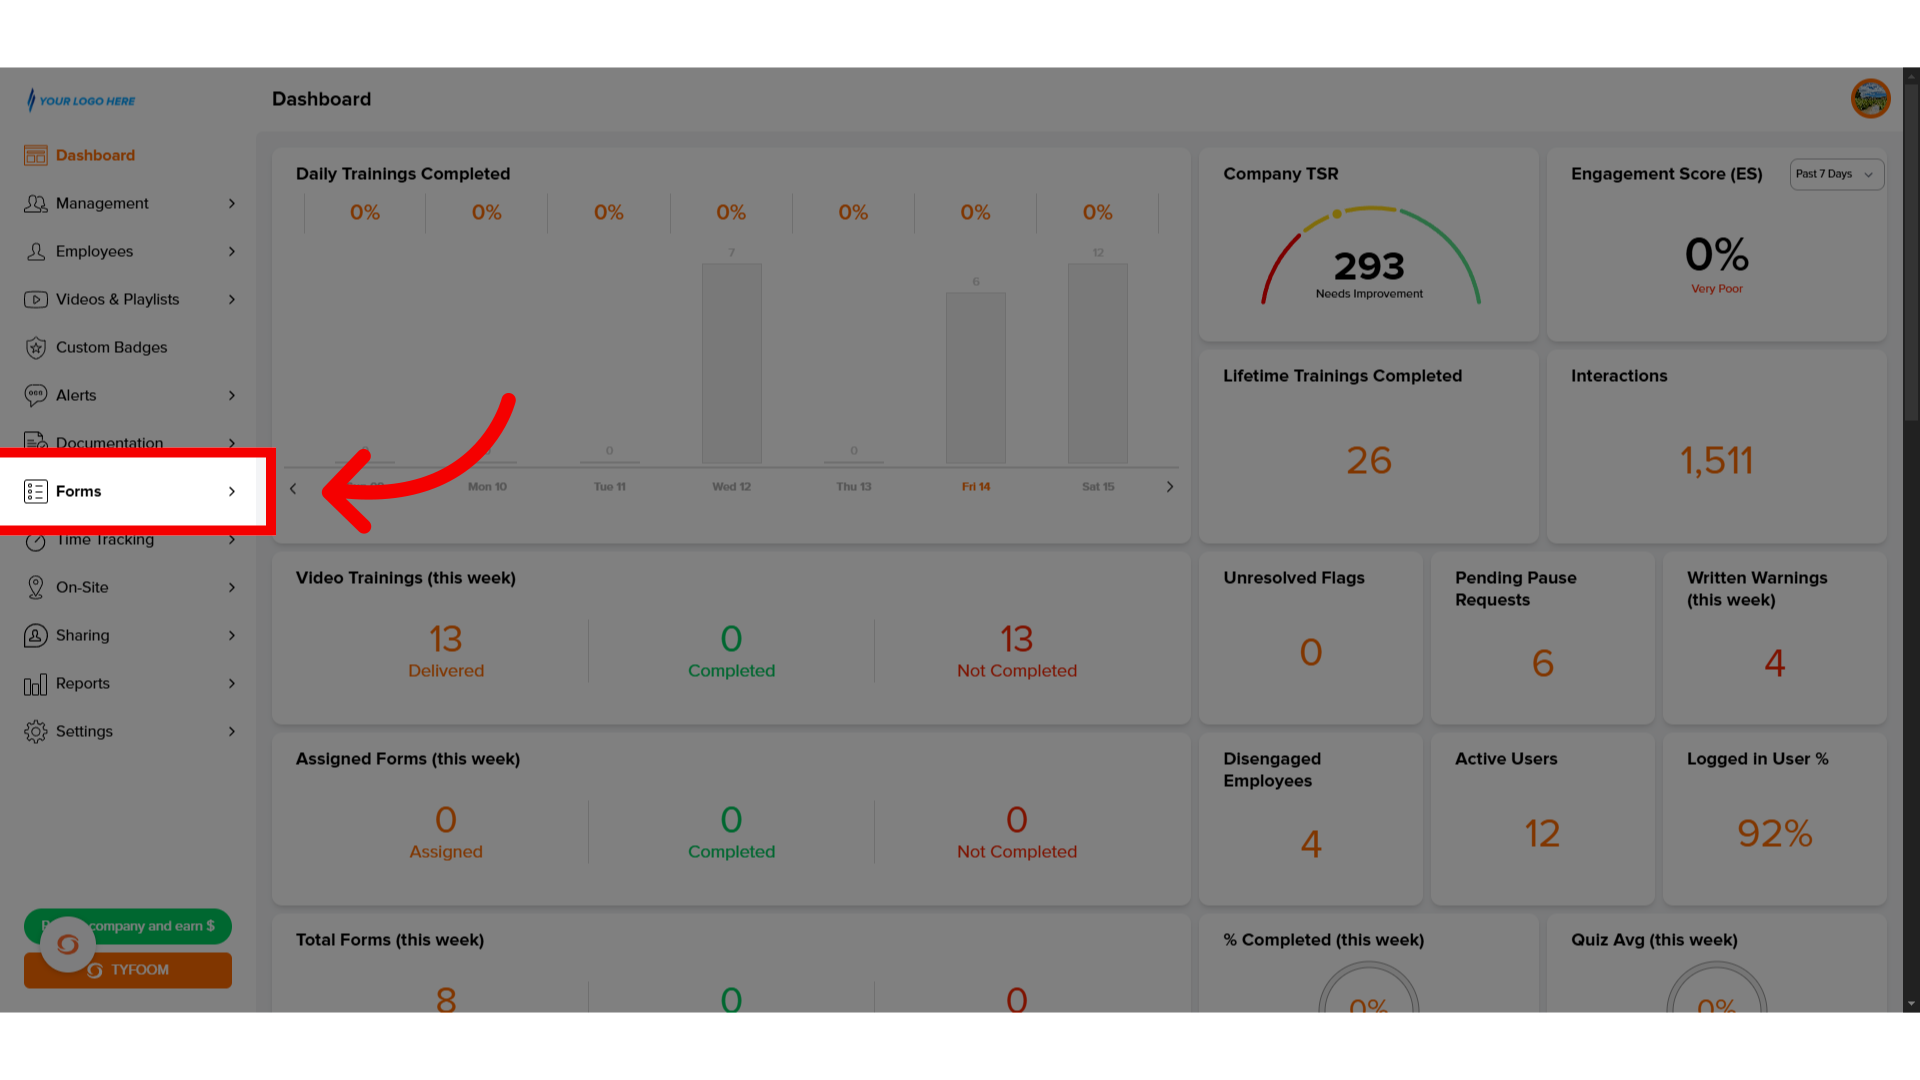
2. Click "Forms"
Go to the Forms tab.
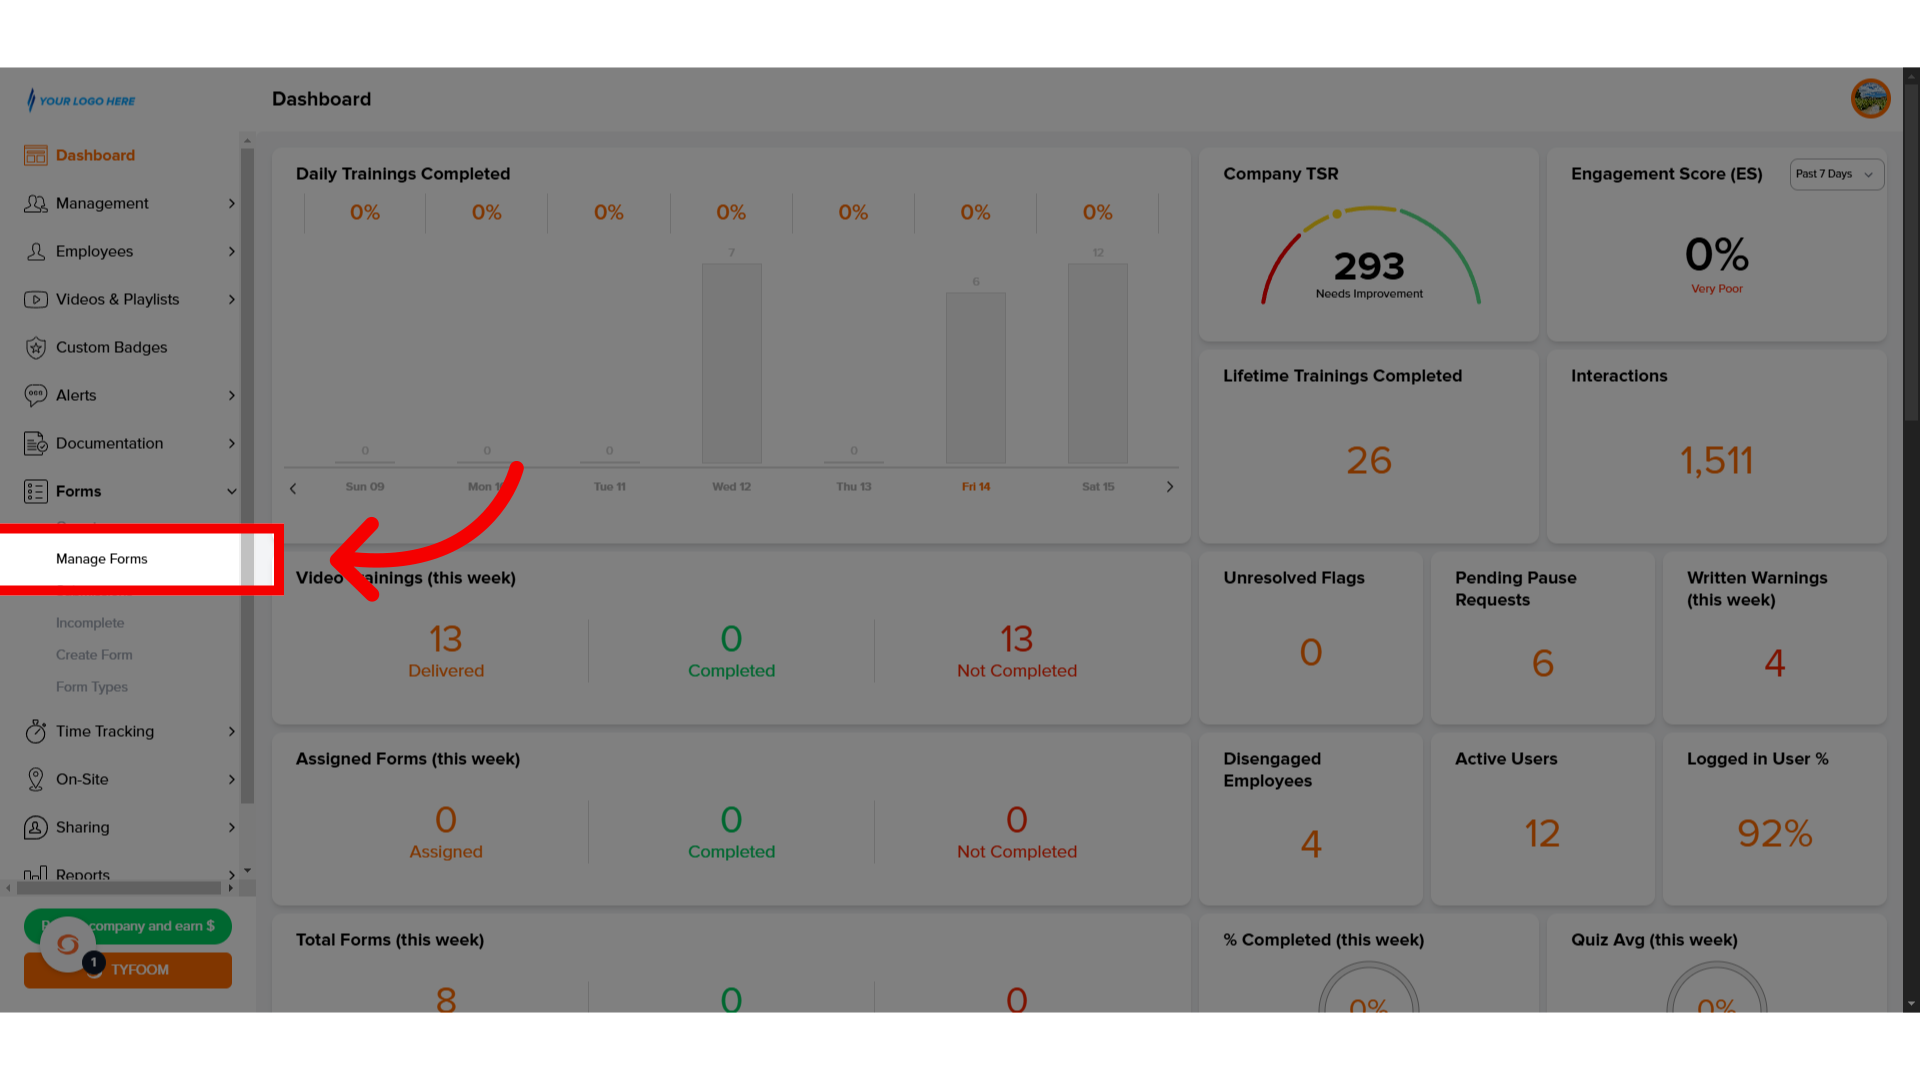
3. Click "Manage Forms"
Then click on "Manage Forms" to view all published forms.
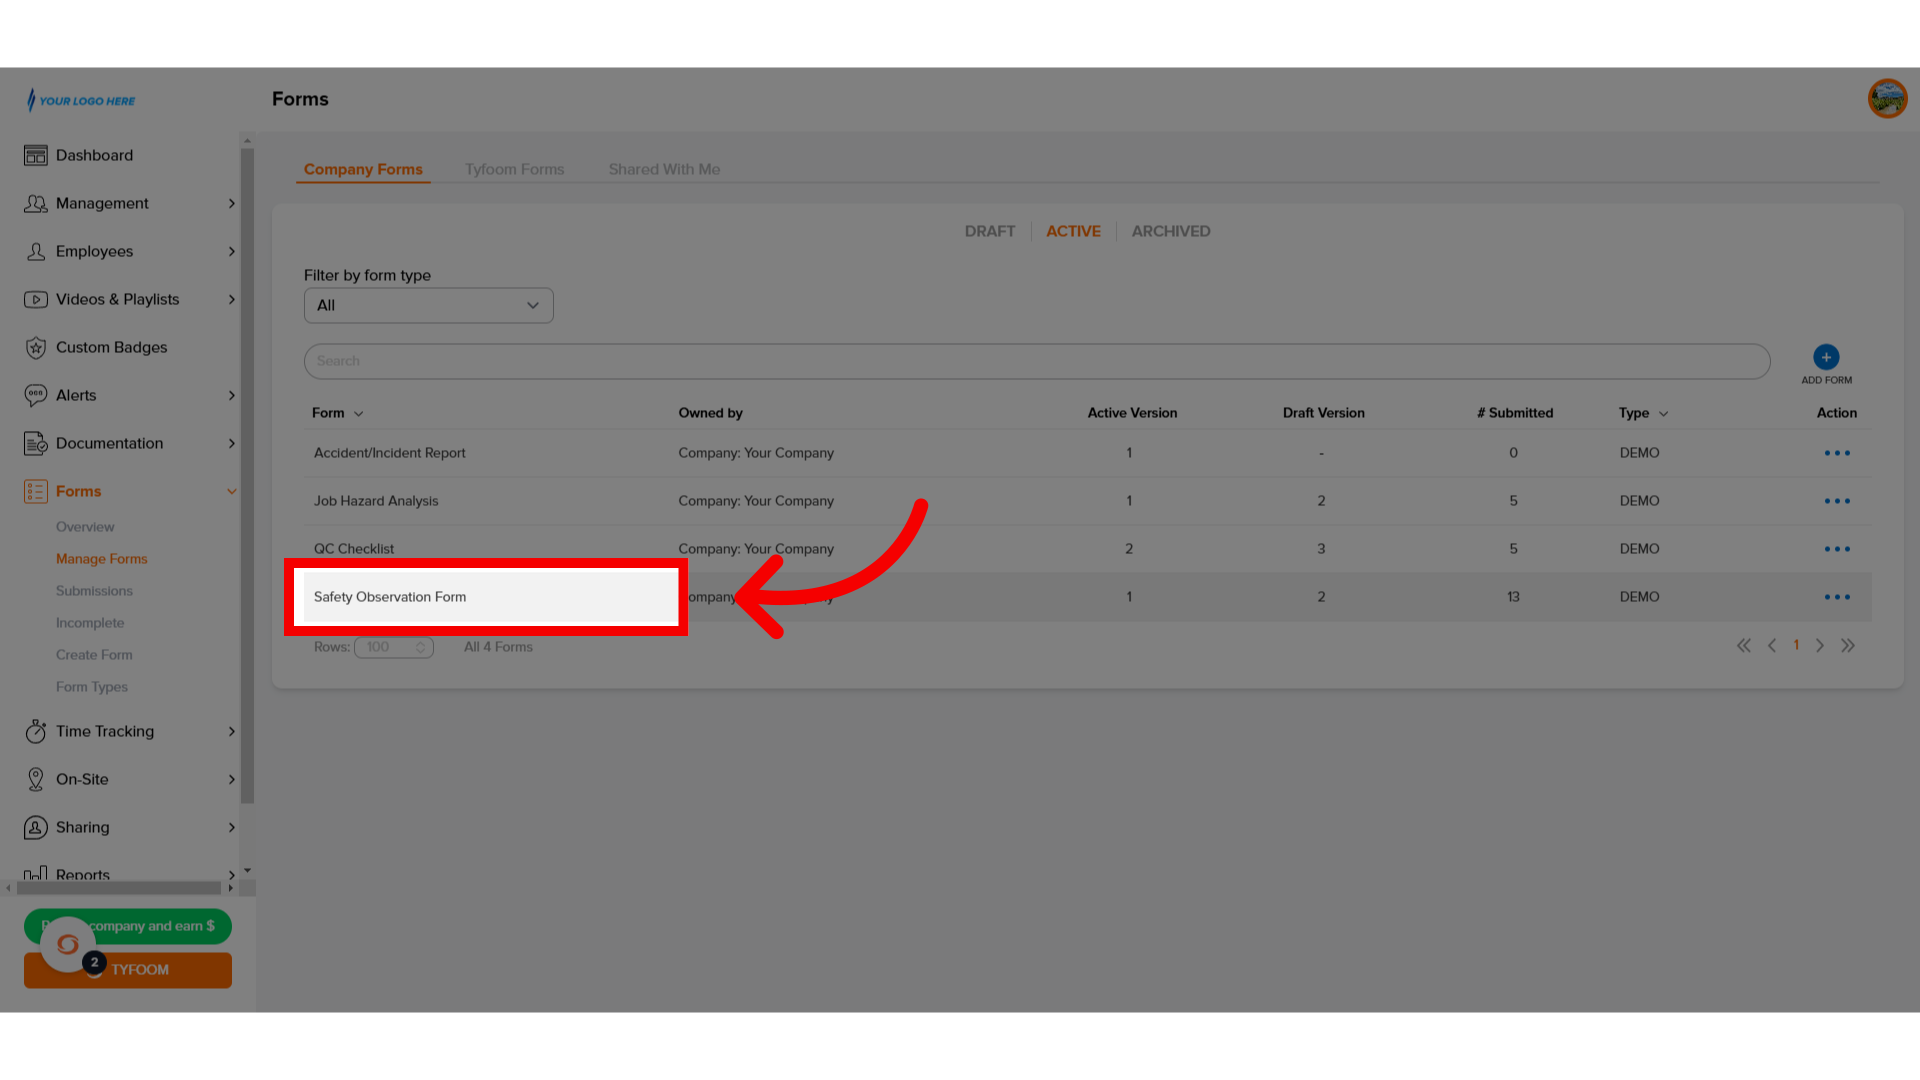
4. Select "Form"
Click on the form that has the data you want to turn into a graph.
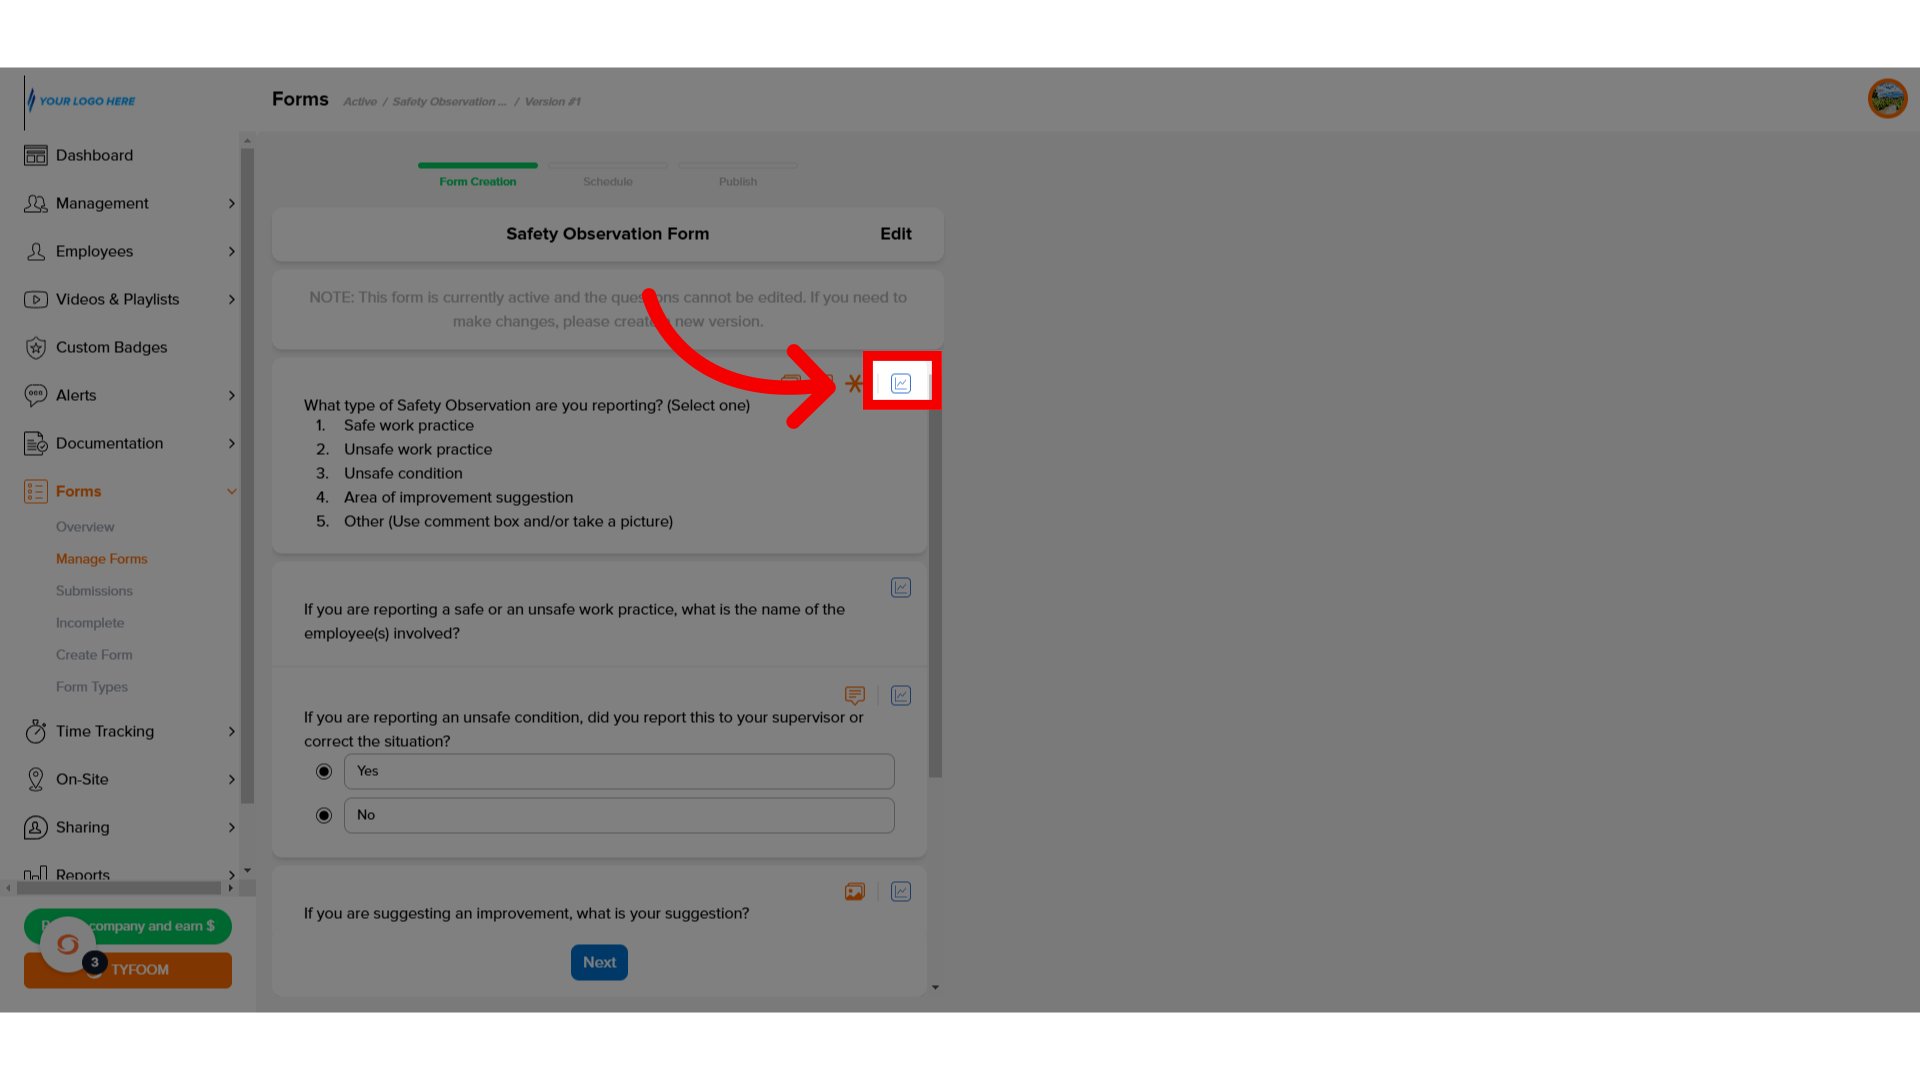
5. Click "Bar Graph"
Click on the graph icon for the Form question you wish to display.
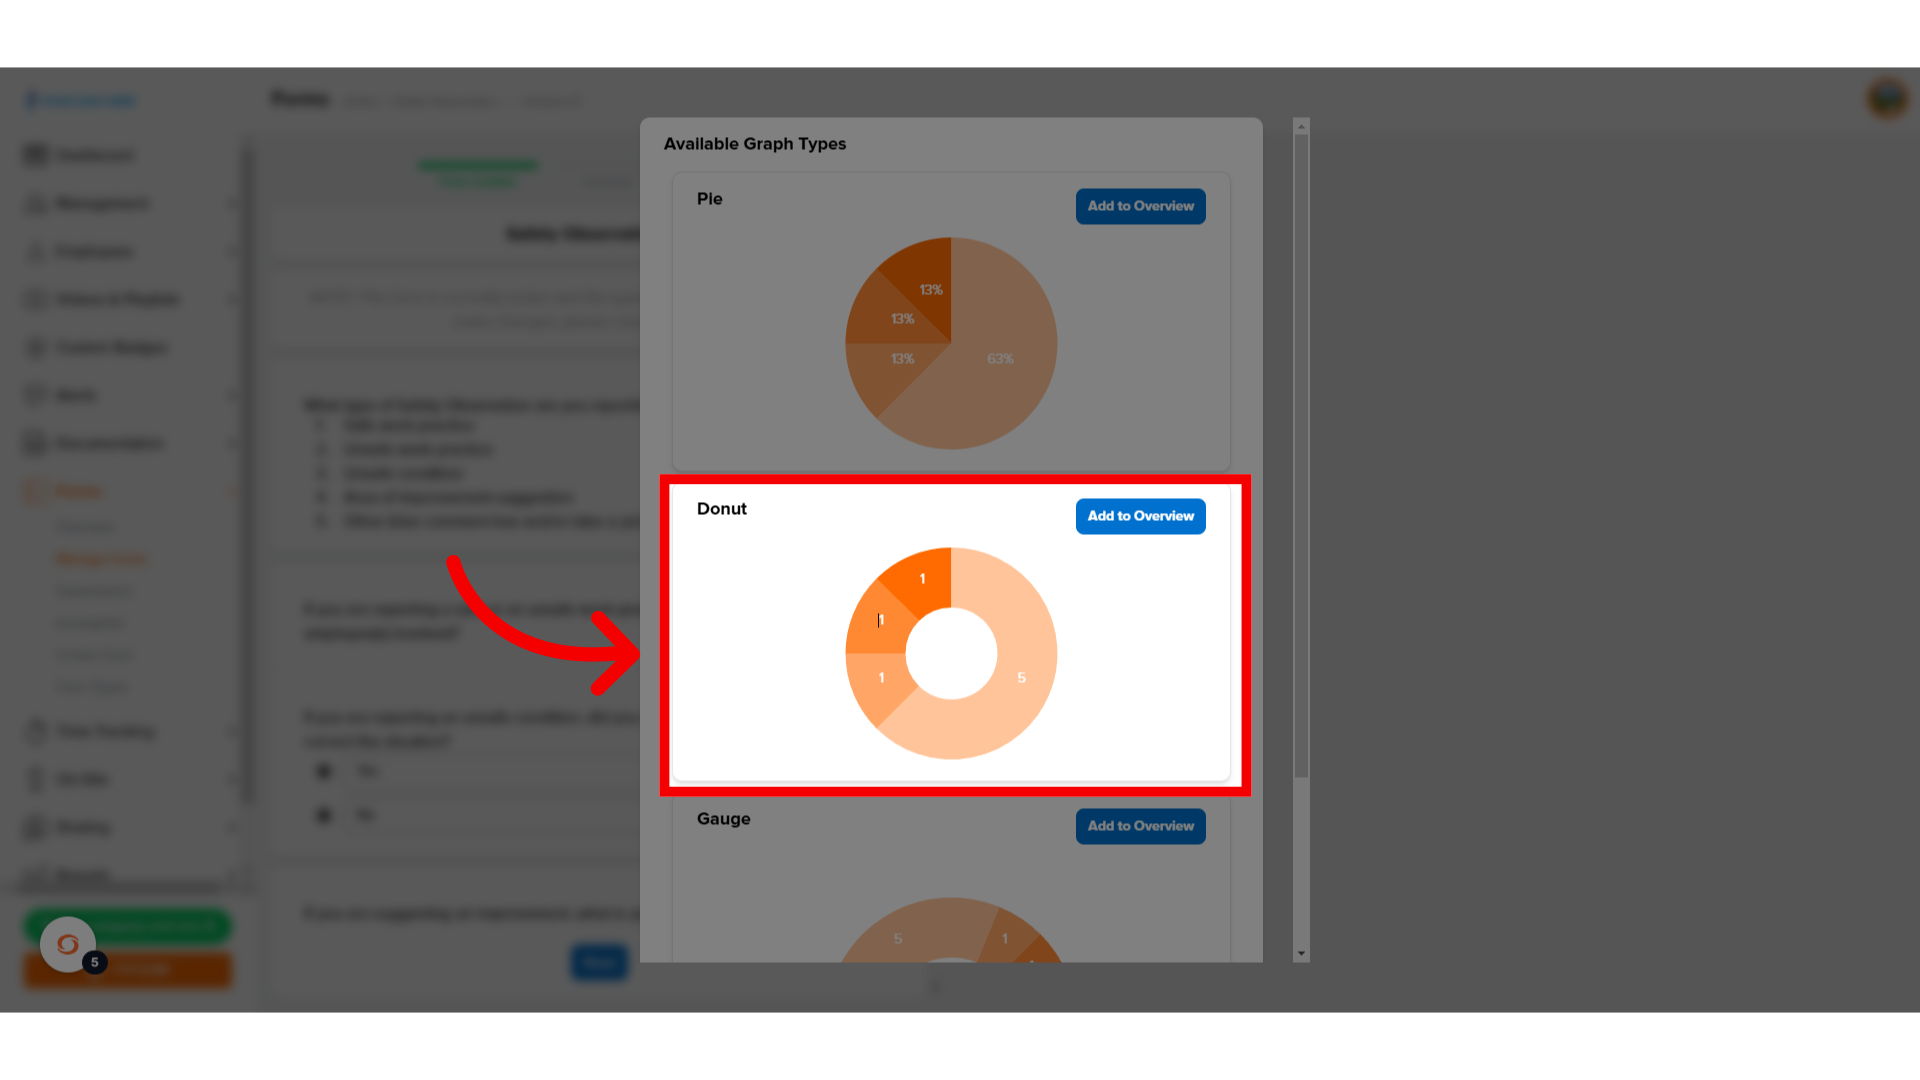
6. Chose "Graph"
Select which graph you wish the data to be displayed as.
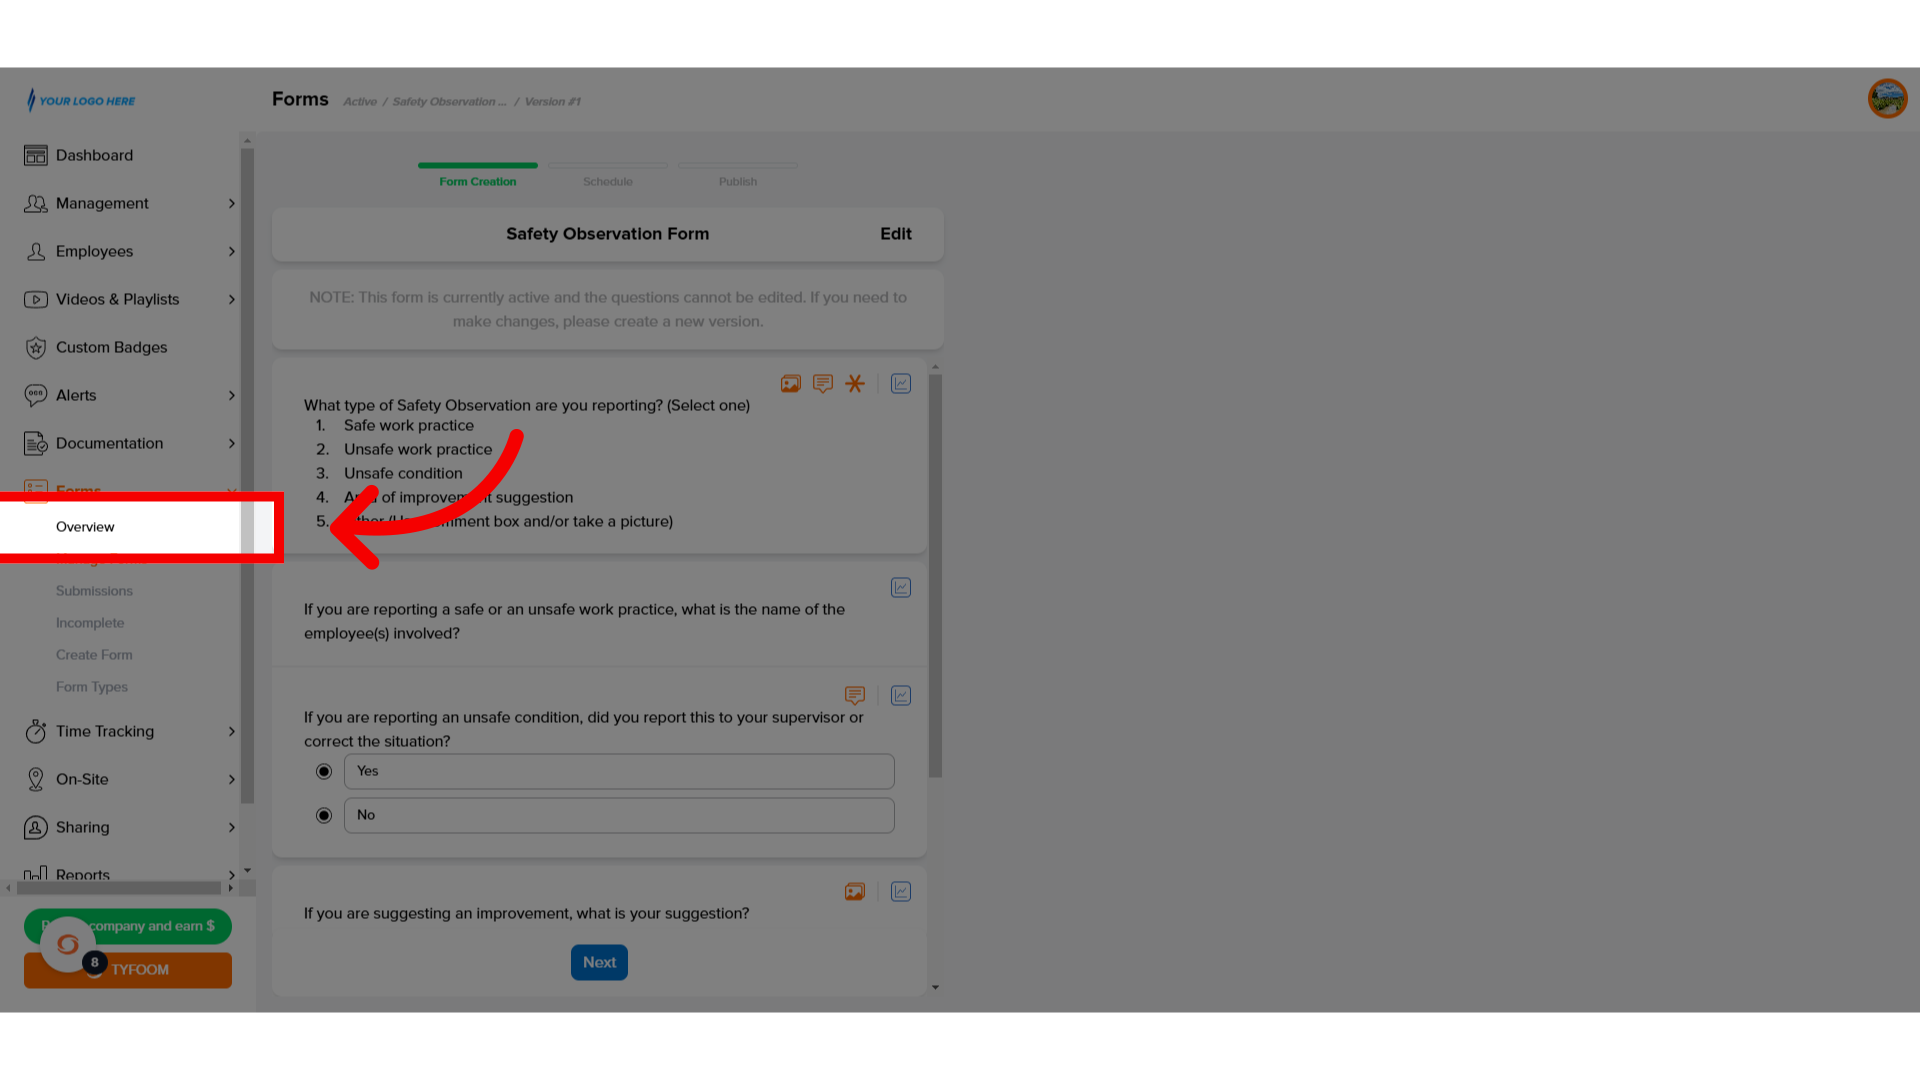
7. Click "Overview"
After the graph has been added to the overview, you can see it by going to the overview page.
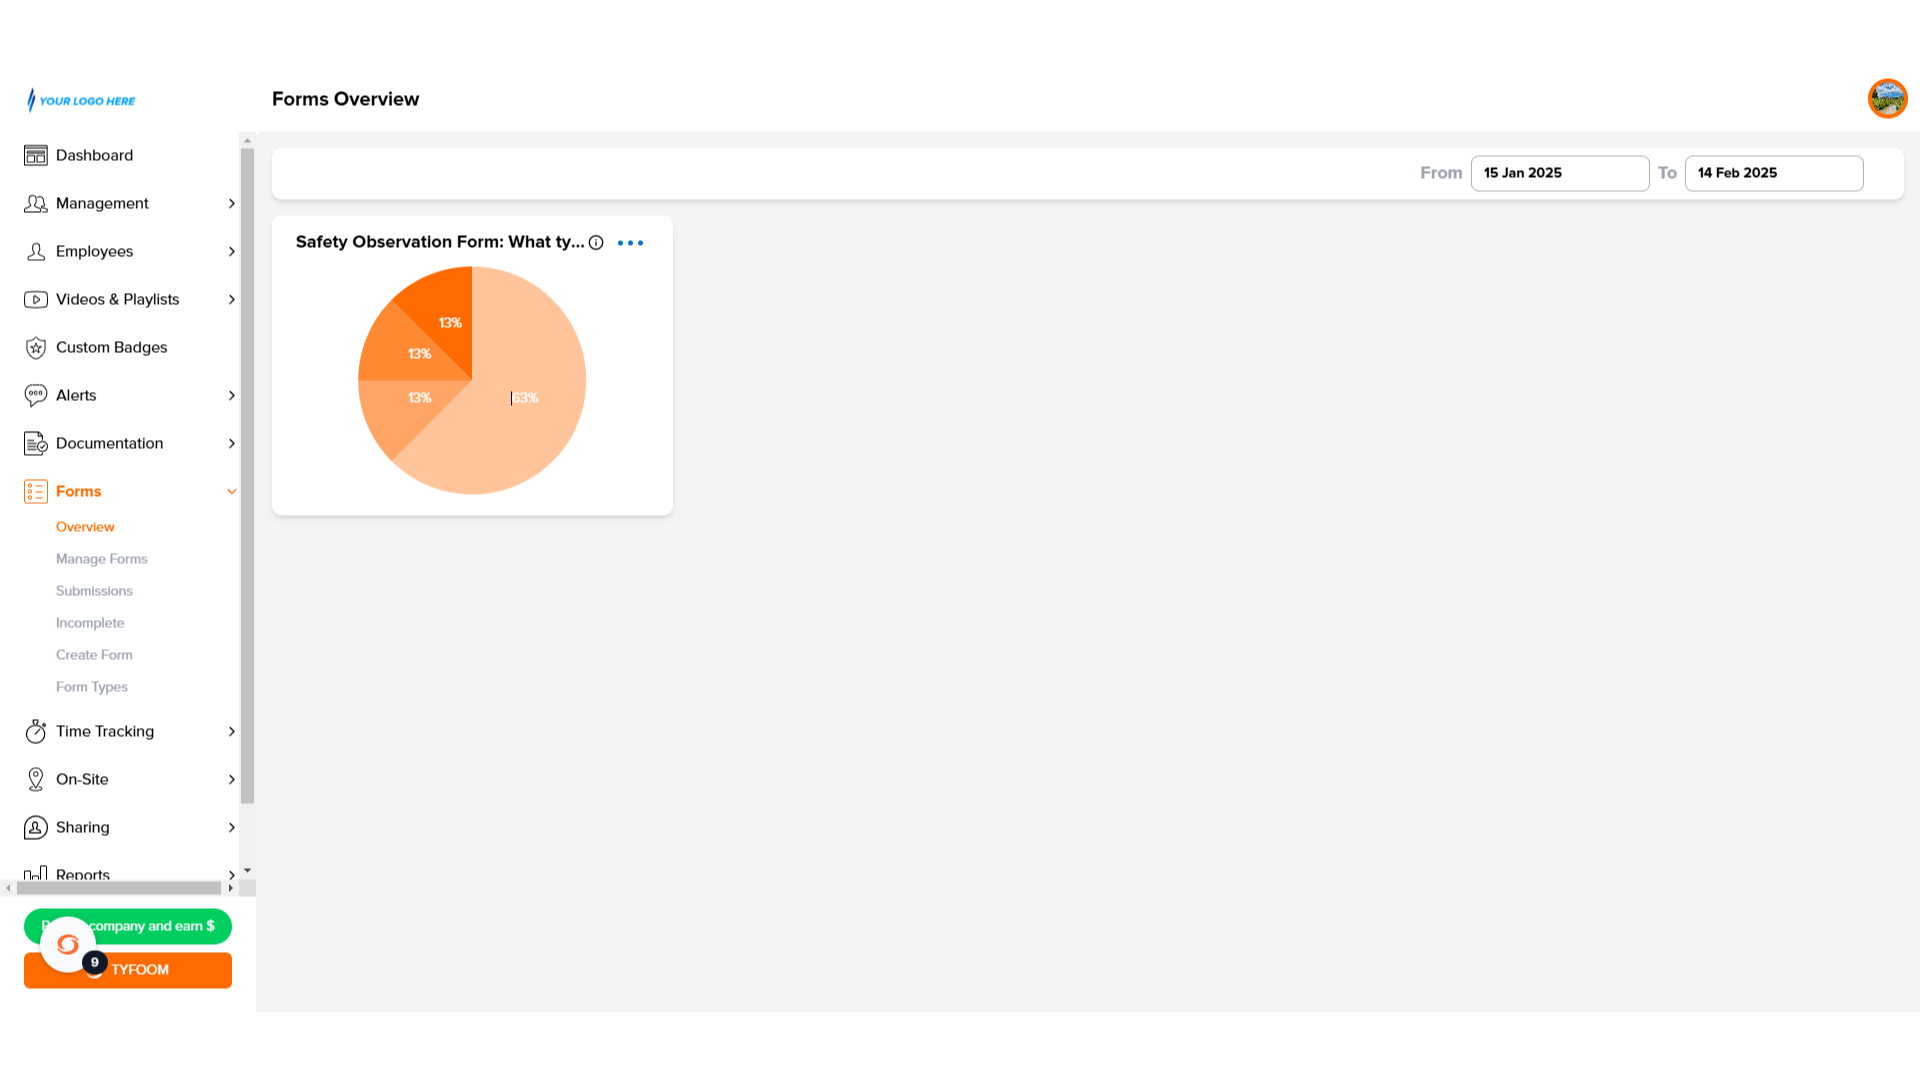
8. Form Overview Page
The graph for that question will be displayed here.
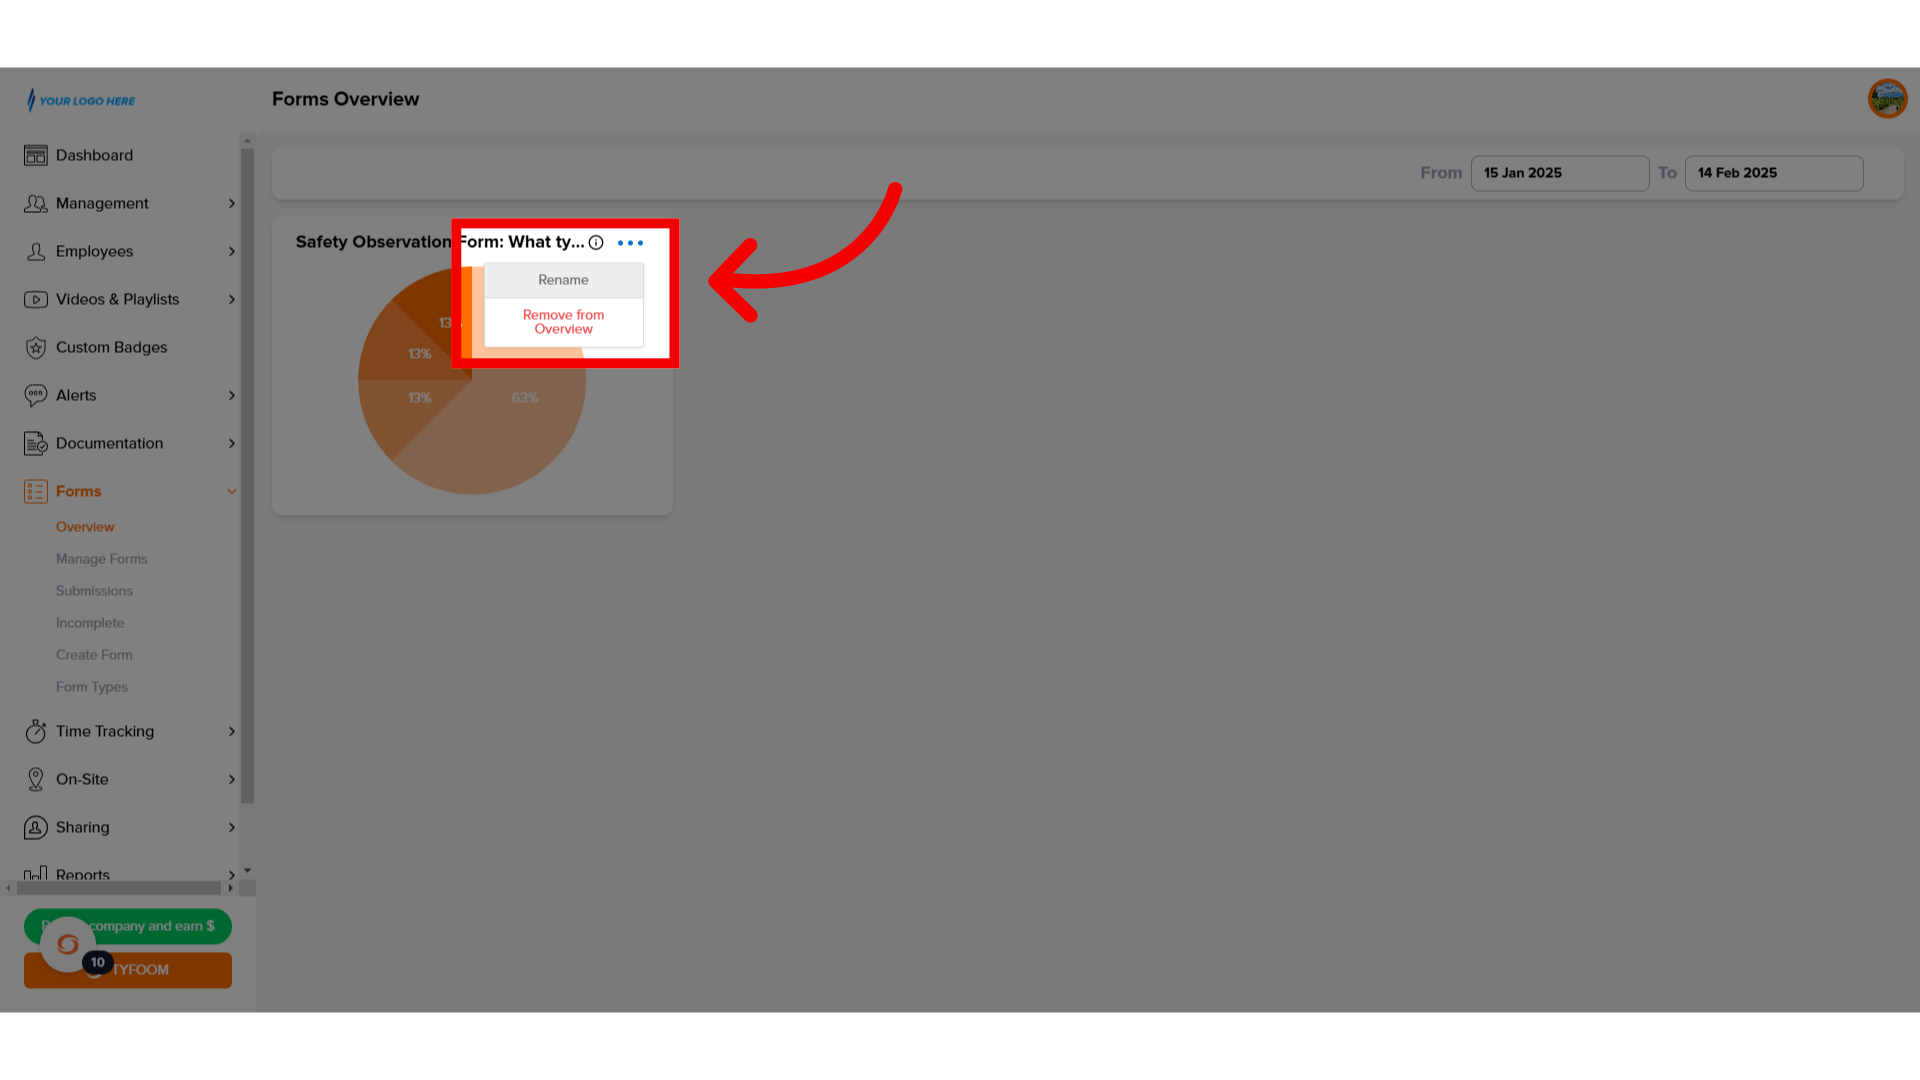
9. Click "Rename"
If you want to rename the graph, click on the Action button, then "Rename".
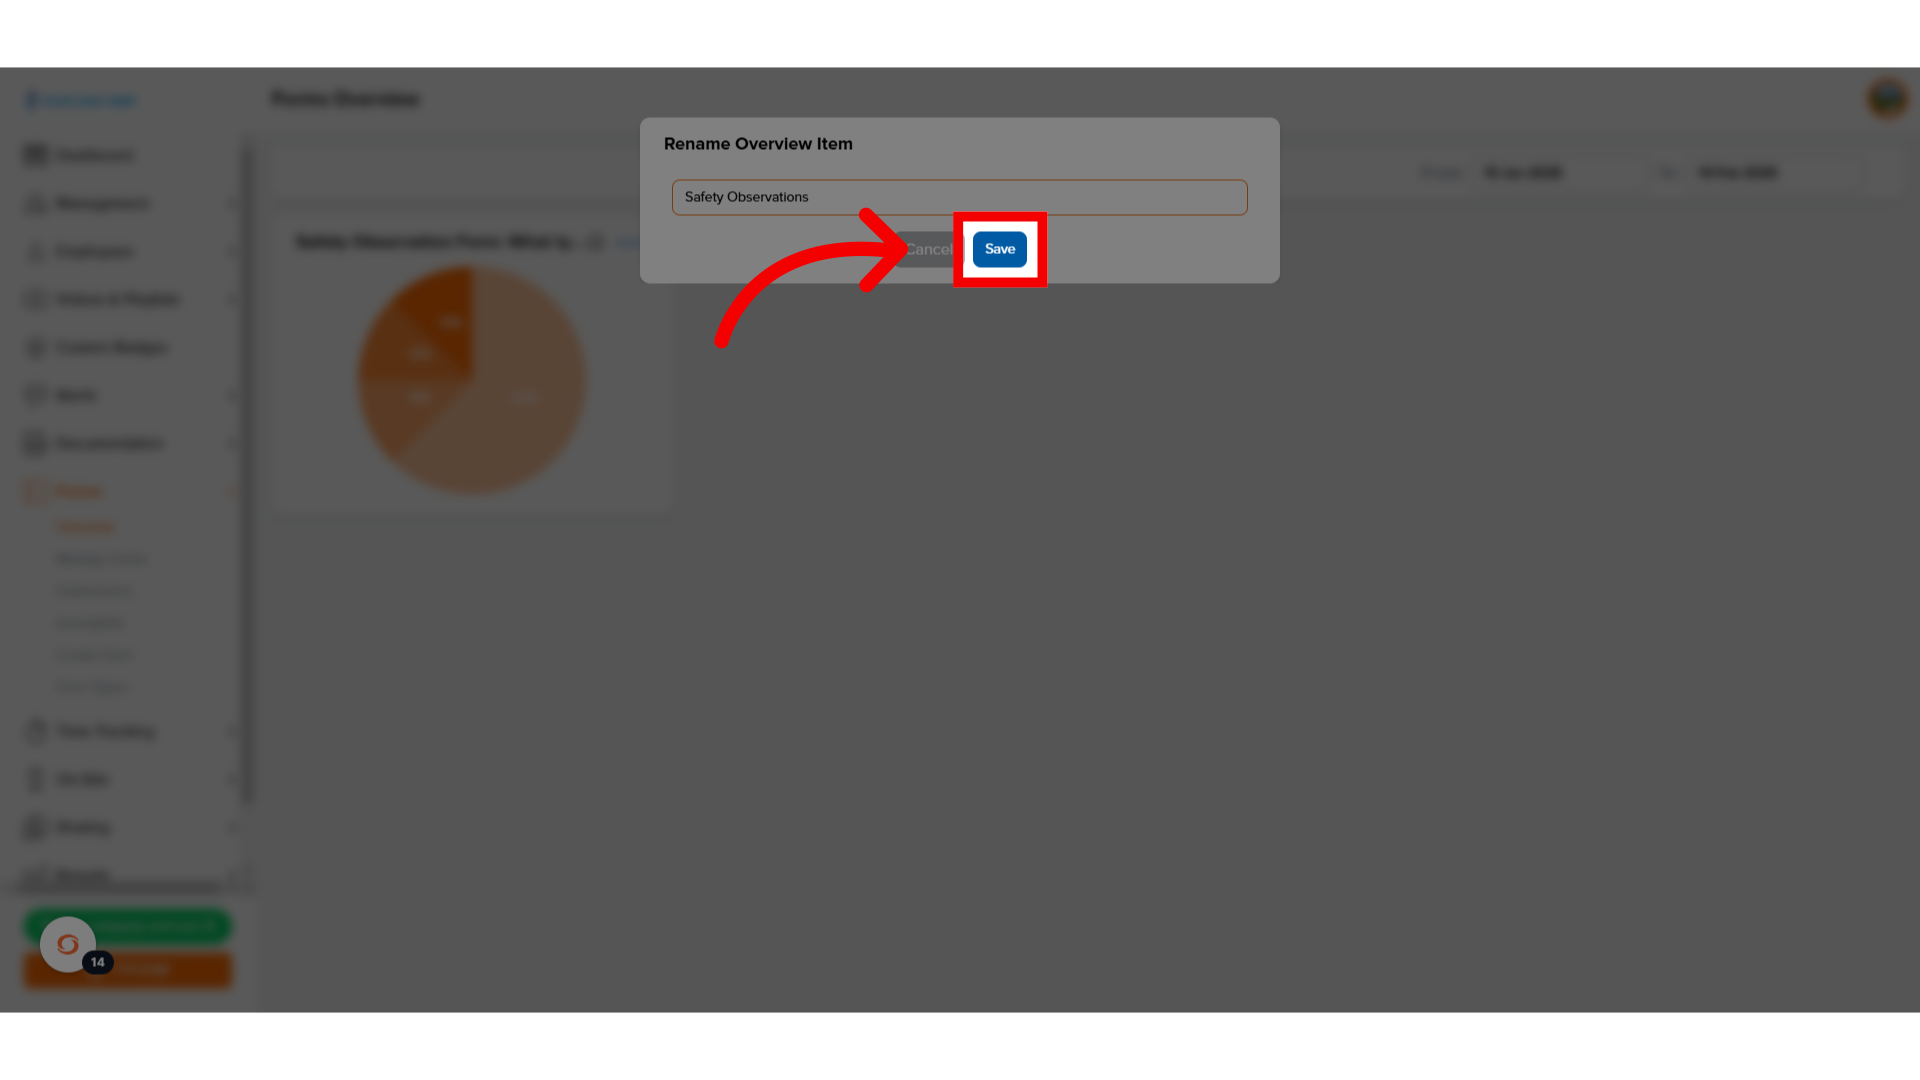
10. Click "Save"
Once the graph has been renamed, click save.
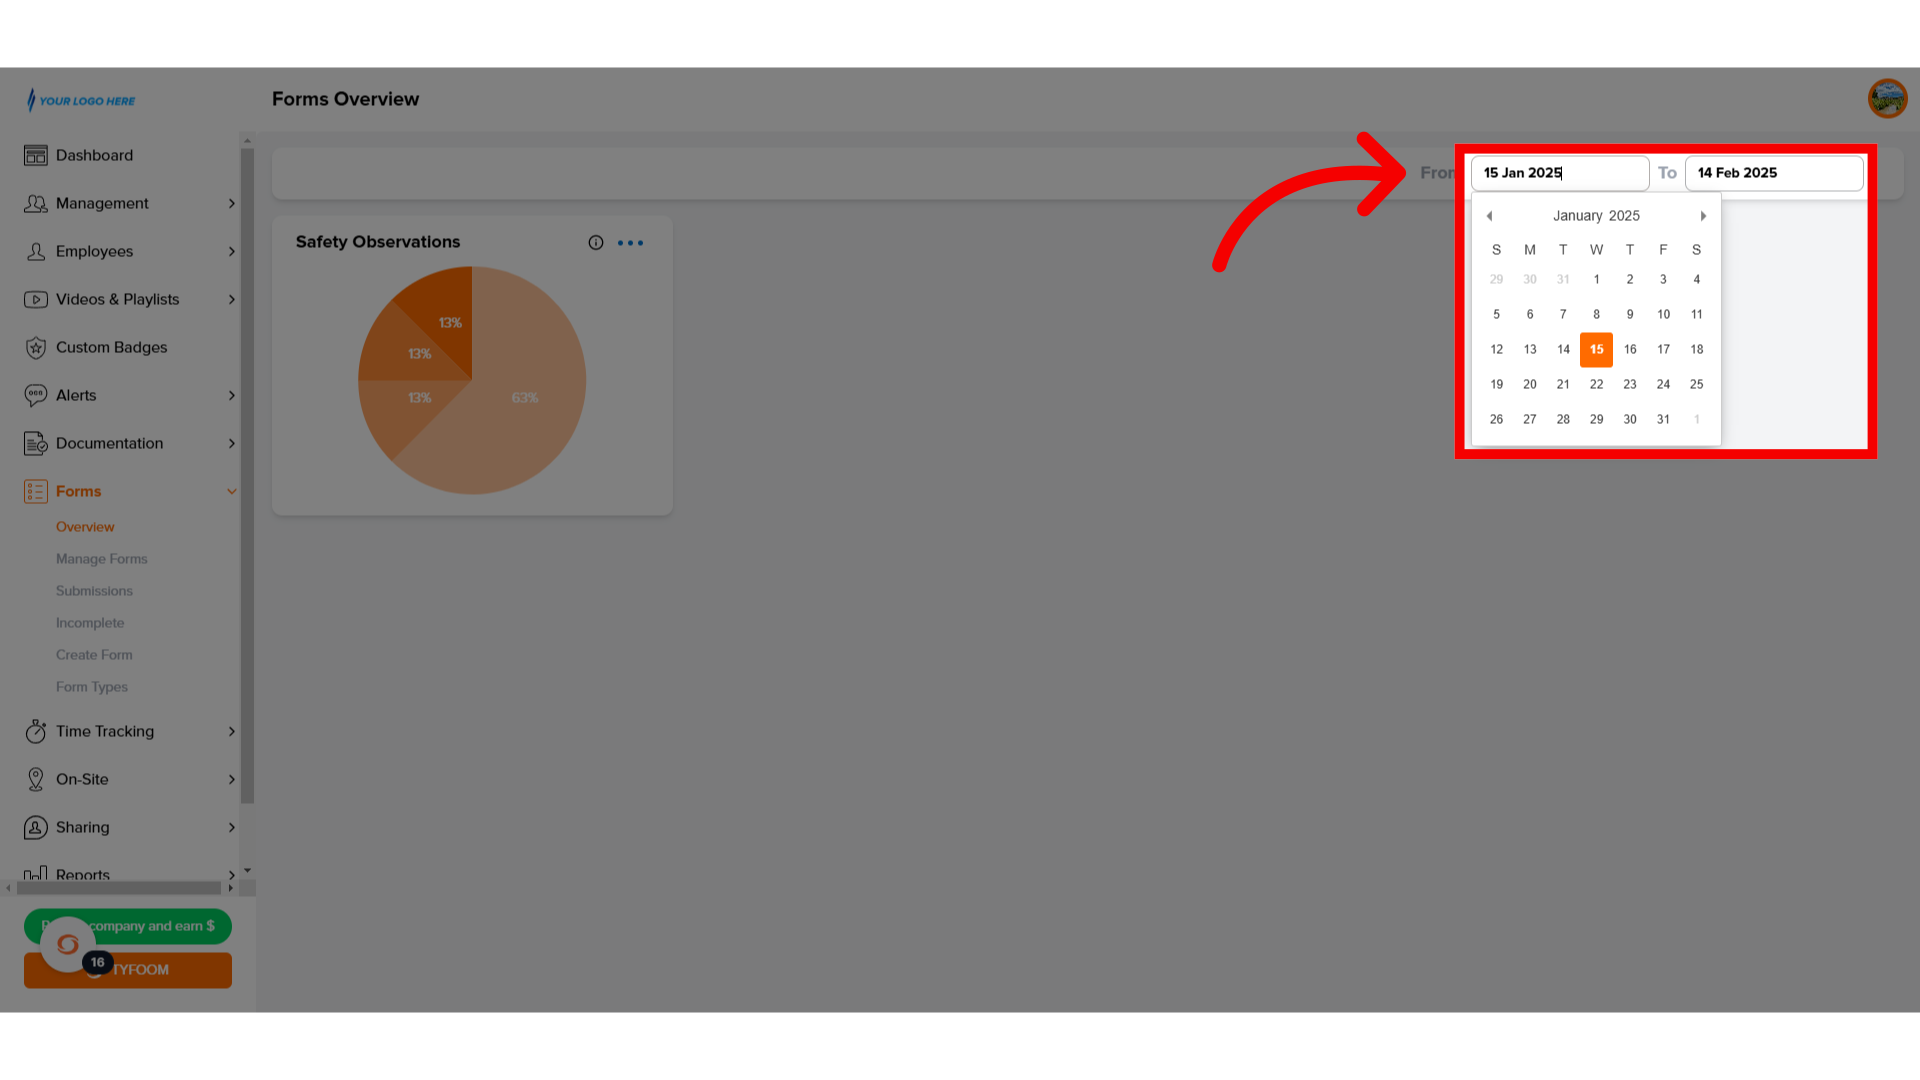
11. Select "Date Range"
You can change the date range for the data to be displayed, by selecting the calendar on the top right.
If you have any questions, contact us at customercare@tyfoom.com
Related Articles
Incident Tracking Overview
This guide will walk you through the process of incident tracking on Tyfoom <br> 1. Click "Incidents" To get started, go to the documentation Tab and then click on incidents. 2. Incidents Page Here, you'll see a list of all incidents. 3. Add ...Anonymous Forms
Anonymous Forms An anonymous form is one your employees can fill out that doesn't capture any of their personal information. Once a form has been chosen to be anonymous, and is published, it cannot be changed. 1. Start on the Manage Forms page To get ...Managing Incomplete Forms
<br> In this guide, we're going to walk you through where, and how an admin can manage forms that have been assigned to employees but not yet completed. 1. Go to the Forms Tab To get started, open the Forms tab in Tyfoom. 2. Click "Incomplete" ...Company Policy Overview and How To
Company Policies A company policy in Tyfoom is any document that you want an employee to read and acknowledge that they've read and will abide by it. Company Policies are found on the Management Tab, and then clicking "Policies" from the sub-menu. ...Tyfoom Forms: Setting Expiration Periods for Assigned Forms
Overview The Form Expiration Period feature in Tyfoom allows admins to define how long an assigned form remains active. This ensures tasks stay relevant and don’t linger indefinitely in the app. How It Works For Admins: Navigate to the Forms section ...